Mapping US & North American Earth Systems


About the Maps
Blog Summary Widget
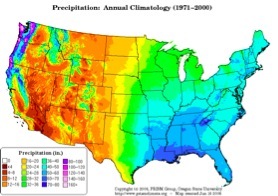
These maps offer nationwide pictures of the information to be included in the revised virtual fieldwork experience (VFE) database. Plus a few more that are just kind of fun. The maps come from a variety of sources. Map keys for biomes, elevation, precipitation, and bedrock provided the color coding scheme for impending revisions to the VFE database. The temperature key is drawn from the slightly different color scheme used by the National Weather Service. Clicking on each map from within its page will take the user to the original source, which is also noted in the maps caption. Some maps show only the 48 contiguous states.
Viewing these maps in a way that allows for rapid switching between maps can highlight the interaction of Earth systems. The pages linked below offer high resolution copies of the maps, but the comparison of maps is easier to make by using this PowerPoint Presentation. You can download it as a PowerPoint, or view the presentation as a webpage.
As you view the set of maps, consider the interaction of Earth systems. How does one system influence another? Watch the Snake River Plain (the U shaped feature largely in Idaho) as you switch between maps. What do you see? What other features seem to appear across multiple maps? Why?


View the maps aligned in a PowerPoint presentation: