Virtual Fieldwork Database Entry Form
This page hosts the VFE Database Entry Form. Find it embedded below. There are only a few required fields:
1. Place Name
2. Hyperlink for VFE (or note that virtualfieldwork.org will be the host)
3. Author
-
4.Abstract
...
-
9.Iconic Image URL
...
Additionally, either 11 (a complete address) or 12 & 13 (latitude and longitude) should be completed.
If you are only completing the required fields, these instructions may be skipped over. Scroll down to find the form.
To distribute the work of assembling this data, consider assigning different students or different student groups to find different data points. If two groups are assigned the same data, this provides a check and reduces the likelihood of error.
The text preceding the embedded form include instructions that add information that was not possible to include within the forms text boxes. This primarily includes hyperlinks as hyperlinks are only active in the form’s header. Some images are included as well.
12 & 13. Latitude & Longitude in decimal degrees.
Google Earth displays the latitude and longitude of the location of the cursor at the bottom of the map window. If it is not displayed in decimal degrees, change how this is displayed in the preferences. There are also several online latitude and longitude finders, like this one: http://itouchmap.com/latlong.html.
15 & 16. Minimum & Maximum Elevation (ft)
Use a topographic map or Google Earth to determine the minimum elevation of the field site. Overlaying a topographic map in Google Earth or Google Maps may make it easier to identify the highest and lowest points within a field site. GPSVisualizer.com allows for the quick creation of these overlays. See: http://www.gpsvisualizer.com/kml_overlay. As USGS maps show elevations in feet, we have adopted this convention. The database will also convert values to meters.
Geology
This section has questions specific to geology. Some questions refer to information that can be found on geologic maps. Geologic maps of all fifty states are available in Google Earth format from the USGS here: http://tin.er.usgs.gov/geology/state/.
17 & 18. Youngest & Oldest Rock
What is the age of the youngest rock? Find information about rock age and type by downloading the digital (Google Earth) geologic map for your state. Opening the state map and clicking on your site will reveal information about the site's rock. Identify the rock age by the name of the geologic time period shown. For example, the youngest rock at Taughannock Falls State Park in Ithaca, NY is Upper Devonian. Find the official, current geologic time chart here: http://www.stratigraphy.org/.
20 & 21. Landscape Type/Physiographic Region: Division & Province
Physiographic Regions of the Lower 48 United States (http://tapestry.usgs.gov/physiogr/physio.html) is a labeled map that can be used to identify your physiographic region. The labeled divisions, are shown in this question with provinces in the next.
Biology & Soil Classification
This section has questions specific to biological activity at the site. As much biological activity is dependent upon soil, (and biological activity influences soil formation) soil is included in this section as well.
25 & 26. Ecoregions
A map entitled, United States Omernik Ecoregions is found here: http://www.geoplatform.gov/home/webmap/viewer.html?webmap=c694f5e9b94246c98506df9b1592dba3. Use this to classify your site by ecoregion. These questions originally referred to biome, but were updated to ecoregions as the content is closely related and this map is simpler to use. To learn more about Omernik Ecoregions, click here.
27. Soil pH
This might be the result of testing done by the user or from a reference. See: http://www.sage.wisc.edu/atlas/maps/soilph/atl_soilph_nam.jpg for a generalized map of soil pH. pH is measured on a scale from 1 to 14.
Climate
28a. Köppen-Geiger Climate Classification
Go to the Updated Köppen-Geiger climate map of the world and download the Google Earth file. Find your location and click on the map. Enter the three letter code for your climate.
28b. Go to http://www.weather.gov/climate/ to find climate normal data for your area. Click on your area on the map, and then click the NOWData tab. Once on the NOWData page, find the location nearest your site under “2. Location >>”. Follow directions below for finding specific climate data.
29 & 30. Average Annual Low & High Temperature
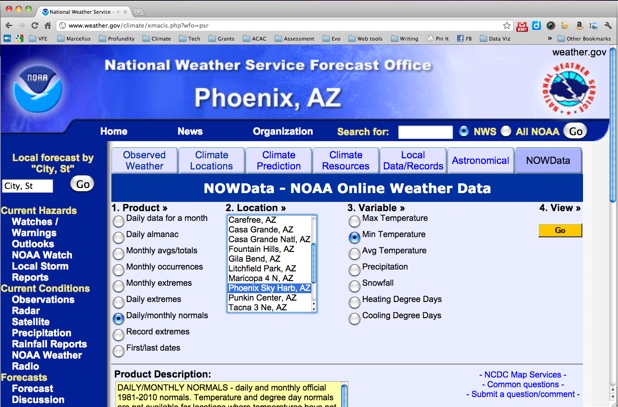
On the NOWData site for your region, select the following: 1. Product >> Select “Daily/monthly normals” 2. Choose the location nearest your field site. 3. Variable >> Select “Min Temperature.” for the low temperature and “Max Temperature” for the high. 4. View>> Click “Go” Record the lowest and daily values.
The picture below shows the appropriate options for finding the average annual low temperature. After clicking “Go” and recording the lowest average daily temperature, close the data window and change “3. Variable” from “Min Temperature” to “Max Temperature,” click “Go” and record the highest daily value.