Lake Effect Snow


As you explore the materials on and links from this page, there are some things you should know for basic navigation. Clicking on many of the images will take you to the image source and some of these pages have additional resources for learning about snow and lake effect snow.
You should also know that this page is new and we want feedback on how to make the resources more effective in learning about snow. This page has resources for learning about snow, but it may not tell you everything you wish it did. Some of that’s intentional. You’ll learn things more deeply if you figure them out yourself rather than simply being told, so this question is more about raising questions than answering them.
This is part of a larger project for learning about Earth science, especially about using Earth science that’s local to the students involved. Everything in the project relates to the question: Why does this place look the way it does? Answering that question always starts with observation. What does the place we’re talking about look like?
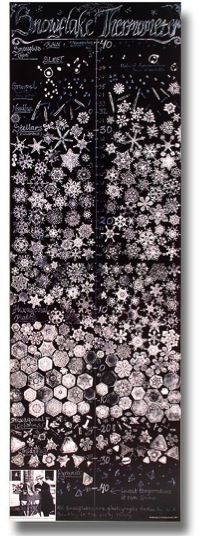
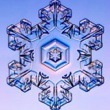
The Snowflake Thermometer Poster
Why Do Lake Effect Clouds & Snow Look the Way They Do?

Investigating Snow
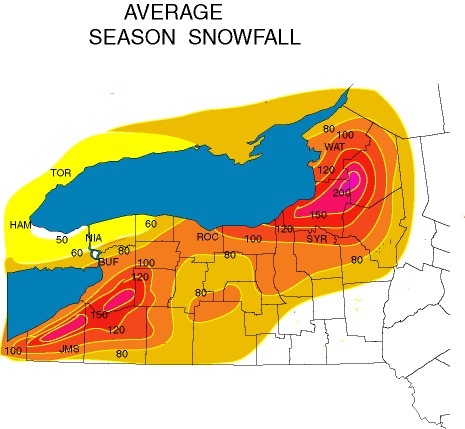
Lake effect snow requires lake temperatures above air temperature. To find the temperatures of Lakes Erie and Ontario, visit this webpage from National Weather Service Office in Buffalo, NY. For surface temperatures of all the Grat Lakes, see the Great Lakes Sea Grant, coastwatch site. The temperatures found here can be compared to those in the Great Lakes area cities on the map above.
Interesting Maps:
Average Seasonal Snowfall Over the Eastern Great Lake Region
The current weather conditions in selected Snowy locations
The map and the boxes below it show the weather for some of the snowiest locations in the United States. Do this:
-
 Zoom out on the map to view the contingent 48 states.
 -
Click on the snowflakes to see the current weather at different locations and the average annual snowfall for those locations.
-
Zoom in on the Great Lakes.
-
Look for similarities among the snowy locations. What factors are common for snowy places?
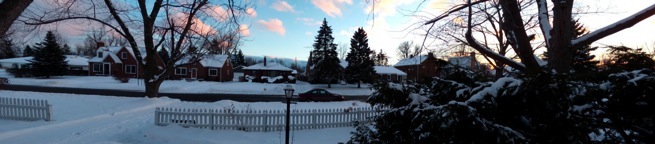
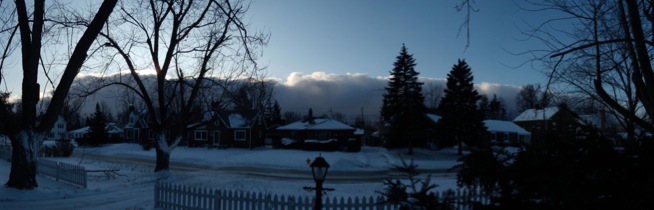
Lake effect clouds over Buffalo, NY on January 21, 2011.
In thinking about snow and lake effect snow, we can connect to those questions above by asking more questions:
-
What do snowflake size and shape tell us?
-
What can we learn from studying a snow profile (and how is that like soil profiles and rock outcrops)?
-
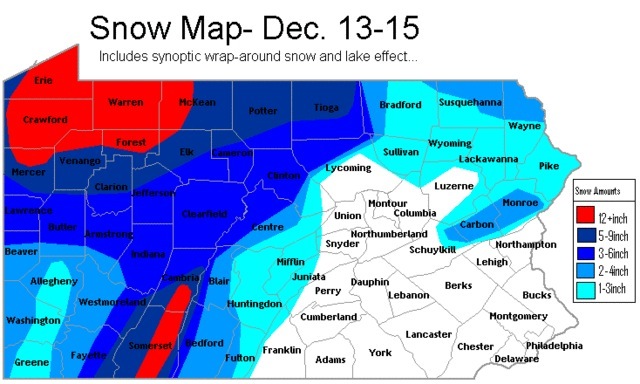
How does the depth of snow differ across a state or region? Why does is vary the way it does?
-
How do technologies like radar and satellites help us better understand and predict the weather?
-
How does snow relate to biology, chemistry and physics?
Selected Resources:
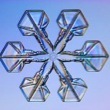
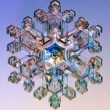
The pictures of individual snowflakes are from A Guide to Snowflakes and that site can help you identify different snowflake types.
Here are some other resources related to snowflake identification, some of which give indications of what the shape indicates.
-
Snowflake Shape and Size Identification Procedure (pdf) (from NASA) This student handout describes procedures for collecting and analyzing snowflakes. Here’s the recording sheet for the activity. More NASA weather resources can be found here.
-
The Snowflake Thermometer Poster (from Vermont Snowflakes; shown at right) blends art and science, showing beautifully how snowflake shape is related to temperature.
NASA’s History of Winter website has how to videos for studying snow. See especially the information on snow pits.
Check out the radar loop here. It shows a days-long lake effect snow event in Michigan’s Lower Peninsula. What do you notice?