VFE Resources: Database data Sources

Introductory Information:
-
1.Place Name
-
2.Hyperlink for VFE
-
3.Author(s)
-
4.Year Submitted
-
5.Abstract
-
6.Grade Level
-
7.Topic Focus (if applicable)
-
8.Software Required
Geography:
-
9.Teacher Friendly Guide Region
-
10.Iconic Image URL
-
11.special features
-
12.Address
-
13.Latitude
-
14.Longitude
-
15.Land use
-
16.Minimum elevation
-
17.Maximum elevation
Geology:
-
18.Youngest Rock (use tapestry map rather than ISC chart)
-
19.Oldest rock
-
20.Uncomformities
-
Landscape type
-
21.Division
-
22.Province
-
23.rock type (include pulldown menu that includes all possible combinations)
-
24.Rock Type Image (ignore this)
-
25.Rock names
-
26.Dominant processes(?)
Biology:
-
27.Primary biome
-
28.Secondary Biome
-
29.Soil pH
-
30.Soil type(?)
Weather & Climate:
-
31.Nearest Weather Station
-
32.Average January low temperature (note that these need to be changed -- data in fields show averages)
-
33.Average July high temperature (note that these need to be changed -- data in fields show averages)
-
34.Average annual precipitation
-
35.Average annual snowfall
What are the VFE database Fields?
Digital Geologic Maps of US States
PRISM Climate Group

SoilWeb: An Online Soil Survey Browser
Page created: May 23, 2011


Maps
Climate Data
Looking across Data Sources
Some of the sources listed on this page, like the PRISM Climate Group described immediately above, provide information that suit multiple purposes.
Climate Graphs

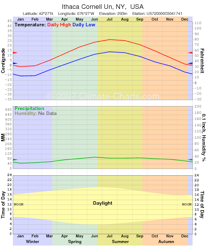
A key factor in determining why a place looks the way it does is the climate. With a little practice, you’ll be able to get a basic understanding of a region’s climate with a glimpse at its climate graphs. Both of the graphs to the left represent the climate for Ithaca, NY.
The top chart, from Climate-Charts.com, color-codes the seasons with winter in blue, spring in green and so on. Precipitation is shown in the center graph. Daylight hours are shown in the bottom graph.
To find climate graphs on Climate-Charts.com, follow the link from the homepage to USA Climate (assuming you’re in the USA). Then, click on the appropriate state and find the location closest to your site from the list of weather stations.
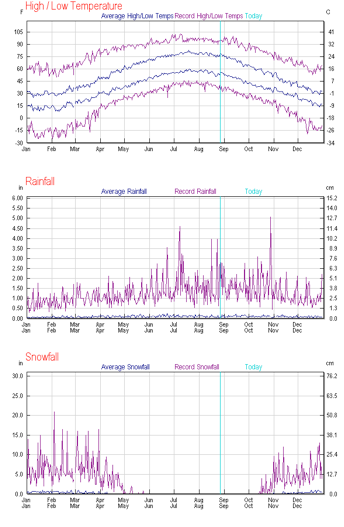
The bottom chart, from Weather Underground, shows record high and lows in addition to averages. These records can be shown or omitted, as can the previous year’s data. Precipitation is separated into two charts, one for rainfall and another for snowfall. The turquoise line shows the date the image was downloaded.
To find the charts on Weather Underground, locate your site by inputting either the zip code or the place name at the top of the page. This will bring you to the current forecast for your site. (To include current weather on a VFE web page, see Weather Stickers in the Outside Resources section of virtualfieldwork.org) Find the “Seasonal Weather Averages” link in the “History & Almanac” section of the page. Follow this link to the climate graph.
There are other sites with climate graphs, including those from the National Oceanic and Atmospheric Administration (NOAA.gov) and the National Weather Service (weather.gov). Some of these show very thoughtful design, however there is less consistency across the country for how the graphs are presented from these sites than from either Climate-Charts.com or Weather Underground.
Climate & Weather Data
US Climate Normals are available from NOAA. This will take you to state by state reports of all major weather stations. It is as comprehensive a data set as you are likely to find.
Michael Hansen has created a KML file that allows Google Earth to display current weather station data from all airports, large and small. Weather stations are identified by airport abbreviations and do not include city names. I used Internet searches to identify city names and then looked up the climate data in the US Climate Normals reports. KADM, for example, is the Ardmore, OK airport.
The sites that provide climate graphs (above) all provide climate data, but some of it may take some time to sift through to find basic data. For things specific to your state, you might find information from your state climatologist’s office useful. You can get there through the American Association of State Climatologists. The Northeast Regional Climate Center posts the US Comparative Climate Data compiled by the National Climatic Data Center in simple tables sorted by state. This data covers the entire US, but not all stations. The entire data set may be downloaded as a .pdf here.
Climate Change: NASA’s Eyes on Earth also offers a great deal of climate data and interpretation of that data.
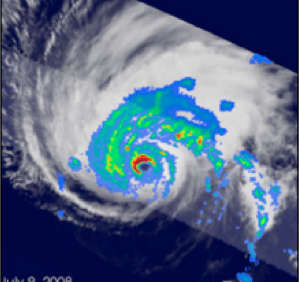
The National Aeronautics and Space Administration has a wealth of freely available resources for understanding the Earth. A great deal of this data is packaged especially for teaching science at Mentoring and InquirY using NASA Data on Atmospheric and earth science for Teachers and Amateurs (MY NASA DATA (take note, if you thought ReaL Inquiry was a torturous title)).
MY NASA Data
vfe database links

The National Aeronautics and Space Administration has a wealth of freely available resources for understanding the Earth. A great deal of this data is packaged especially for teaching science at Mentoring and InquirY using NASA Data on Atmospheric and earth science for Teachers and Amateurs (MY NASA DATA (take note, if you thought ReaL Inquiry was a torturous title)).
Introductory Information:
This section has general descriptive information about both the site and the nature of the VFE.
-
1. Place Name: Provide the name of the field site. This might be a park name, a school name, or something like "Road Cut on Simpson Road in Springfield, MA," or, "The Chenango River at Norwich High School."
-
2. Hyperlink for VFE: Where, online, is the VFE housed? If it is a file to be loaded on virtualfieldwork.org and does not have an associated website, email appropriate files to Don Duggan-Haas, and respond to this question by stating: to be hosted by virtualfieldwork.org.
-
3. Author(s): Who created the VFE? Enter last names first and separate authors names with a semicolon. For example: Simpson, Lisa; and Flanders, Ned.
-
4. Year Submitted
-
5. Abstract: In 50 to 100 words, describe the VFE. Your description should concisely describe the nature of site's geology; the technology used in the VFE and the educational approach used. It should also indicate the scale of the VFE.
-
6. Grade Level: Select all that apply.
-
7. Topic Focus (if applicable): All VFEs developed for ReaL Earth System Science are driven by the question: Why does this place look the way it does? Some VFEs may also target one of the supporting questions we've developed for that driving question, or a question that is specific to the particular site. For example, a VFE has been developed for Crater Lake driven by the question, "Why is the water so blue?"
-
8. Software required to explore the virtual field site: The most commonly used software for exploring the site are Google Earth, Google Maps, PowerPoint, Apple Keynote and a web browser. It is not necessary to identify software that was used in creation of the VFE if that software is not used to explore the virtual site. For example, Gigapan software is needed to create Gigapan images, but it is not needed to view them.
Geography:
-
9.Teacher Friendly Guide Region
-
10.Iconic Image URL
-
11.special features
-
12.Address
-
13.Latitude
-
14.Longitude
-
15.Land use
-
16.Minimum elevation
-
17.Maximum elevation
Geology:
-
18.Youngest Rock (use tapestry map rather than ISC chart)
-
19.Oldest rock
-
20.Uncomformities
-
Landscape type
-
21.Division
-
22.Province
-
23.rock type (include pulldown menu that includes all possible combinations)
-
24.Rock Type Image (ignore this)
-
25.Rock names
-
26.Dominant processes(?)
Biology:
-
27.Primary biome
-
28.Secondary Biome
-
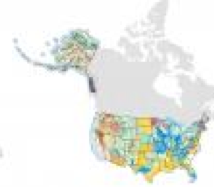
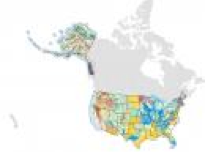
29.Soil pH: One source for a generalized look at soil pH across North America is found here.

-
30.Soil type(?)
Weather & Climate:
-
31.Nearest Weather Station: Go to http://cdo.ncdc.noaa.gov/cgi-bin/climatenormals/climatenormals.pl?directive=prod_select2&prodtype=CLIM81&subrnum= to find climate normal data for your state. These publications include National Weather Service station locations. You may also use http://lwf.ncdc.noaa.gov/oa/climate/stationlocator.html to locate stations. Enter Zip Code or other location information into the search field.
-
32.Average January low temperature (note that these need to be changed -- data in fields show averages). Use the the Climate Normals
-
33.Average July high temperature (note that these need to be changed -- data in fields show averages)
-
34.Average annual precipitation
-
35.Average annual snowfall
